The tokens must flow.
Your GPUs are expensive golden eggs. When they fail to hatch tokens, you lose output while the costs keep running. KTLO keeps your fleet healthy and productive—and only bills for healthy GPU-hours.
Built for AI teams running on GPUs, and the neo clouds and AI factories that supply them.
The scan is free and read-only. Nothing in your cluster changes without your approval.
A token is a word, or part of one, that an AI produces. Every answer is built from them. They don’t have feelings (we checked), but your GPU bill does.
Not every egg delivers. Try another hatch.
Will AI take over the world?
The robots are coming for your job
Meanwhile, inside your data centre…
It’s not Skynet. It’s a full cache.
They’re not taking over. They’re stuck in traffic. Every token in that queue is GPU time you’ve already paid for, producing nothing, while a customer waits.
Inside your hatchery right now
Every GPU is a golden egg. At $4 an hour, one that sits idle 30% of the time wastes about 2,600 hours, roughly $10,500, a year. Here are six nests with six everyday problems: tap one to see what’s going on, then let KTLO in. The share of tokens that make it out is your Token Yield, and it’s the number we exist to raise.
Nest too hot
“I’m sorry, Dave. I’m afraid I can’t do that.” Not a rebellion: the GPU is at 92°C and slowing itself down.
What it costs you
You pay full price for a slower chip, every hour it happens.
What KTLO does
We spot it, prove it with data, and hand the data centre the evidence to fix the cooling.
The yields here are an illustration. The free scan measures the real ones in your cluster.
This is where they wanted to go.
Once they’re out, tokens line up into the work your customers are paying you for.
The right crew for your GPU operation
From maintaining hardware to delivering cloud capacity and running AI workloads, find the products built for your team.
GPU Data Center Operators
For teams responsible for physical GPU infrastructure.
Maintain & repair Forge CP Trained technicians maintain GPUs, replace faulty hardware and debug links, guided by Forge software. Explore Forge CP →Cloud & Neo Cloud Providers
For providers delivering reliable GPU capacity to customers.
Validate Crucible Burn in new racks, reproduce customer issues and validate repairs before handover. Explore Crucible → Optimize capacity TokenMax Align power and cooling with workloads to deliver more capacity from the same site. Explore TokenMax →AI & ML Teams
For teams using GPUs to train models and serve inference.
Keep workloads running Forge Operate your cluster around the clock, recover jobs and escalate hardware faults to your cloud provider. Explore Forge →Good egg or bad egg?
Hatcheries shine a light through every egg before it goes in. It’s called candling. Crucible does it for GPU racks: it burns in new nodes under production load, runs customer problem validation (CPV) on anything suspect, and proves the repair before a node goes back in the pool.
Day 0: catch bad nodes before your customers do.
Its brain is a fine-tuned model with a large skills library. It runs on its own, and your data-centre technicians approve anything that needs hands on the hardware.
New for neo clouds: Crucible now comes with TokenMax, which moves power and cooling to wherever tokens are being made. See how they fit together.
Example run: rack-14 burns in, one node shows NVLink and ECC errors, Crucible isolates it, confirms the fault, and returns it after repair.
From burn-in to back in service, without the wait
- 1. Burn inNew racks run at sustained production load across compute, memory and fabric. Weak nodes come out early without stopping the rest.
- 2. ValidateThe CPV suite replays the workloads and failure signatures your customers would hit, on any suspect node.
- 3. DiagnoseThe model and skills library read the results, name the failing part and build an evidence bundle for the vendor or technician.
- 4. ReturnAfter the repair, CPV runs again. The node goes back in the pool only when it passes.
Have you tried turning it off and on again? Forge did.
For AI & ML teams training models and serving inference. The first rule of IT, automated. Forge watches every node, link and job around the clock. It reads telemetry and logs, finds the root cause, and fixes what software can fix from a library of operations playbooks. When it’s real hardware, it opens a case with your cloud provider, attaches the evidence and tracks it to closure.
Your AI cluster, operated by an AI.
Operators set the guardrails, approve high-impact actions, and can override or pause it at any time.
Example incident: a GPU falls off the bus, Forge drains the node and moves the job, tries a reset, then escalates the hardware fault to the cloud provider with one human approval.
Sense, assess, remediate, escalate. Continuously.
- 1. SenseGPU, fabric, storage and scheduler telemetry, plus kernel, driver and job logs, in one cluster-wide view.
- 2. AssessCorrelates signals across layers to find the root cause, and scores the risk to running jobs.
- 3. RemediateRuns playbooks from the skills library: drain, checkpoint, reset, retune, reschedule. Then checks the fix held.
- 4. EscalateFor confirmed hardware faults: builds the evidence bundle, opens a case with your cloud provider and tracks repair and return to service.
Expert hands. Guided by Forge.
Physical GPU maintenance for data center operators. A trained technical team uses Forge software to guide root-cause analysis, replace faulty hardware and troubleshoot GPU and network links.
Technicians work from diagnostic evidence and detailed maintenance playbooks, with repair steps and validation results recorded in Forge.
Great Scott! 170 kW stranded.
That’s NVIDIA’s own 540 kW example. Static provisioning reserves power for every rack’s busiest moment, and 170 kW of it never gets used, like heat lamps warming empty nests. TokenMax treats power and cooling as things to schedule, and moves them to wherever tokens are being made.
Same site power. More golden eggs.
It reads workload, GPU, network, DPU and facility telemetry together, then steers routing, power and cooling as one system to bring down the cost of every token.
NVIDIA’s 540 kW example: static provisioning strands 170 kW; dynamic allocation uses 475 kW and fits one more rack in the same budget.
Three loops, three speeds
NVIDIA’s Dynamic Power Software steers power using power telemetry. TokenMax adds the workload, the fabric and the facility to one model, and decides routing, placement and power and cooling set-points together. Fast decisions never wait on slow ones.
Route the tokens
Scores every rack on predicted tokens/s per kW, power headroom, fabric congestion and thermal margin, then sends new requests, or moves decode sessions by KV-cache transfer, to the cheapest healthy rack.
Steer the power
Forecasts demand for each workload class 15 to 60 minutes ahead, rebalances DPS group budgets, applies power profiles per node, and moves batch and prefill-heavy work to racks with reclaimed headroom.
Tune the cooling
Raises CDU and facility supply temperatures toward the 45°C design point when load and weather allow, stages chillers and free cooling, and shifts deferrable work ahead of grid price peaks.
You don’t have to become a hatchery expert.
KTLO is run by engineers who have deployed and benchmarked these systems in production clouds. We walk every nest, every hour, so your team can get on with building your product.
Your part
- Give us read access to your cluster, with your consent.
- Approve anything risky before it runs.
- Read one short report a month.
Our part
- Measure where every GPU-hour goes, and what it’s worth.
- Tune the memory, storage and serving software for your actual workload.
- Check every chip, every hour, and catch the slow ones early.
- Fix what’s in our hands. For the rest, chase the vendor or data centre with evidence.
- Re-tune as your models, traffic and software change.
- Bill you only for healthy GPU-hours.
How big the gap can be
These aren’t KTLO results. They’re published tests of WEKA’s memory software on identical hardware, and they show how much output the setup around the GPUs decides on its own.
Tokens out per GPU-hour, same hardware
Each capsule is about 10,000 tokens. Source: Nebius and WEKA, one 8-GPU node, same software stack.
People served at once, same 72 GPUs
Each dot is about 100 people. Source: WEKA and Oracle, 9 nodes, 72 GPUs.
Your gap will be different. The free scan measures it.
Show me the tokens.
What’s stuck in your nests? Move the sliders to see. The starting values are examples; the free scan measures your real numbers. If you own your GPUs, use your all-in cost per GPU-hour.
How it’s worked out: value put back is your monthly GPU bill multiplied by the points of yield recovered. The KTLO fee is $0.25 per healthy GPU-hour with a $10,000 monthly minimum; the figure shown assumes every hour is healthy. Unhealthy hours are never billed.
No headache. Three steps.
Free yield scan
Read-only, and nothing in your cluster changes. We measure your Token Yield, where the rest goes, and what it’s costing you.
You approve, we run it
You sign off the plan. We tune and watch everything around the clock, and re-tune as your models, traffic and software change.
You get the results
More output from the same GPUs, one short report a month, and a bill only for healthy hours.
Our partners
KTLO works alongside the companies that build the AI factory, so their technology delivers everything you paid for.
KTLO AI Labs has been accepted into the NVIDIA Inception program. As a member, we are building on NVIDIA’s open source tools and open source AI models.
KTLO AI Labs partners with WEKA to support our customers’ growing infrastructure and scaling needs.
Every token deserves its shot.
You hatched 1 token on this page. Now picture your whole cluster, and find out how many it’s leaving in the nest.
Free and read-only. Nothing changes without your approval.
Good egg or bad egg?
Hatcheries shine a light through every egg before it goes in. It’s called candling. Crucible does it for GPU racks: it burns in new nodes under production load, runs customer problem validation (CPV) on anything suspect, and proves the repair before a node goes back in the pool.
Day 0: catch bad nodes before your customers do.
New: Crucible now comes with TokenMax, which moves power and cooling to wherever tokens are being made, so the racks you hand over also run more from the same site power.
An AI operating system for hardware burn-in, validation and repair. Its brain is a fine-tuned model with a large skills library. It runs on its own, and your data-centre technicians approve anything that needs hands on the hardware.
Example run: rack-14 burns in, one node shows NVLink and ECC errors, Crucible isolates it, confirms the fault, and returns it after repair.
From burn-in to back in service, without the wait
Four stages, one loop. Every node that reaches a customer has passed the same checks the customer would run, and every node that comes back from repair passes them again.
- 1. Burn inLoad it like productionNew racks run at sustained production load across compute, memory and fabric. Weak nodes come out early without stopping the rest of the rack.
- 2. ValidateTest it like a customerThe CPV suite replays the workloads and failure signatures your customers would hit, on any suspect node. Light checks can run on live customer nodes; intrusive diagnostics wait until the node is drained.
- 3. DiagnoseName the partThe model and skills library read the results, name the failing part and build an evidence bundle for the vendor or technician.
- 4. ReturnProve the repairAfter the repair, CPV runs again. The node goes back in the pool only when it passes.
What runs at each stage
The model chooses which tests to run and in what order, based on what it has already seen on the node.
| Stage | What runs | What it watches | What you get back |
|---|---|---|---|
| Burn-in | Sustained production-level load across compute, memory and fabric, for example HPL and NCCL all-reduce | XID events, ECC error counts, NVLink replay errors, PCIe errors, thermals | Weak nodes pulled early; the rest of the rack keeps burning in |
| CPV | DCGM diagnostics, NCCL bus bandwidth, training and inference steps, multi-node collectives, and on-demand reproduction of a reported customer issue | The workloads and failure signatures your customers report | Pass or fail evidence you can share with the customer |
| Diagnose | Skills library match against known failure signatures, for example hw.nvlink.replay_storm | Signals across tests and runs, and how often the fault reproduces | The likely failing part, a confidence score and an evidence bundle for the vendor RMA |
| Return | The CPV suite again, after the repair | The same checks that failed before | The node rejoins the pool only on a pass |
Under the hood
A brain built for GPU hardware, tests written from the customer’s side, and a person in the loop for every part swap.
A brain built for GPU hardware
- Fine-tuned on XID, ECC, PCIe and fabric failures
- Skills for DCGM, NCCL, HPL and vendor diagnostics
- Chooses which tests to run, and in what order
- Gets better with every node it validates
Validation from the customer’s side
- Training, inference and multi-node collective tests
- Reproduces reported customer issues on demand
- Light checks on live nodes, deep diagnostics once drained
- Pass or fail evidence you can share with customers
Lower repair time for hardware issues
- Pulls bad nodes from the pool on the first signal
- Evidence bundles that shorten vendor RMAs
- Human approval for part swaps and RMAs
- Automatic re-validation before a node returns
Good eggs still need warm nests.
Crucible makes sure every node you hand over is healthy. TokenMax, the newest part of the neo cloud offering, makes sure each rack then gets the power and cooling its work needs, instead of a fixed share reserved for its busiest moment.
It reads workload, GPU, network, DPU and facility telemetry together, and steers routing, power and cooling as one system. It builds on NVIDIA’s DSX MaxLPS framework and Dynamic Power Software, and acts through the controls your site already runs.
- Every few seconds: new requests go to the rack with the best tokens/s per kW, power headroom and thermal margin.
- Every few minutes: DPS power budgets and GPU power profiles are rebalanced from a 15 to 60 minute demand forecast.
- Every 15 minutes to hours: CDU and chiller set-points, UPS charging and grid timing follow the forecast load.
Phase one is read-only: a live view of tokens/s per kW and stranded power for every rack. Nothing acts on its own until it has beaten your baseline in recommend mode, inside bands your operators approve.
NVIDIA’s 540 kW MaxLPS example: static provisioning strands 170 kW; dynamic allocation uses 475 kW and fits one more rack in the same budget.
What changes for a neo cloud
- Fewer bad nodes reach customers, because each one is tested the way the customer will use it.
- Lower mean time to repair for hardware issues, because the evidence is ready before the vendor asks.
- Faster vendor RMAs, with reproduction counts and logs attached to every case.
- Racks handed over sooner, because one weak node no longer holds up the other 31.
- More racks from the same site power, once TokenMax is steering power and cooling toward the work.
Catch bad nodes before your customers do.
Bring Crucible to your next rack delivery. We run burn-in and CPV alongside your team, your technicians approve every part swap, and TokenMax can start with a read-only view of your stranded power.
Nothing touches your hardware without a technician’s approval.
Have you tried turning it off and on again? Forge did.
For AI & ML teams training models and serving inference. The first rule of IT, automated. Forge is a cluster operations system that watches every node, link and job around the clock. It reads telemetry and logs, finds the root cause, and fixes what software can fix from a library of operations playbooks. When it’s real hardware, it opens a case with your cloud provider, attaches the evidence and tracks it to closure.
Your AI cluster, operated by an AI.
Operators set the guardrails, approve high-impact actions, and can override or pause it at any time.
Example incident: a GPU falls off the bus, Forge drains the node and moves the job, tries a reset, then escalates the hardware fault to the cloud provider with one human approval.
Sense, assess, remediate, escalate. Continuously.
One loop, running all day and all night, across every layer of the cluster. It doesn’t get tired at 3 a.m., and it writes down everything it did and why.
- 1. SenseGPU, fabric, storage and scheduler telemetry, plus kernel, driver and job logs, in one cluster-wide view.
- 2. AssessCorrelates signals across layers to find the root cause, and scores the risk to running jobs.
- 3. RemediateRuns playbooks from the skills library: drain, checkpoint, reset, retune, reschedule. Then checks the fix held.
- 4. EscalateFor confirmed hardware faults: builds the evidence bundle, opens a case with your cloud provider and tracks repair and return to service.
The skills library
Each skill pairs a failure signature with the playbook that fixes it. The library is large and keeps growing with every incident Forge handles.
| Area | What Forge reads | What it can do about it |
|---|---|---|
| GPU health | XID events such as XID 79 (GPU fell off the bus), ECC faults, thermal throttling | Drain the node, restart its jobs elsewhere from their last checkpoint, reset the GPU and reload the driver, then re-check. Escalate if the fault comes back. |
| Fabric | NVLink, InfiniBand and RoCE degradation: link errors, retransmits, congestion | Isolate the link or node, move jobs off it, and open a provider case with the link evidence attached |
| Jobs | NCCL hangs, stragglers and job-level regressions | Find the slow node, checkpoint, exclude it and restart the job from the checkpoint |
| Storage and memory | Storage stalls, KV-cache pressure and data-path latency | Tune the data path, and deploy, tune and run WEKA’s Augmented Memory Grid for long-context inference |
| Drift | Scheduler, driver and firmware drift across nodes | Flag the drift and roll fixes out node by node, inside concurrency caps |
Autonomous, with humans in the loop
Forge runs on its own by default. Automation is earned, not assumed: new remediations start as dry runs and get more freedom only once they have proved themselves.
Your rules
- Operators set stop-and-ask points
- Approval gates for high-impact actions
- Override or pause at any time
- On-call escalation with the diagnosis attached
Safety before automation
- Dry runs before anything acts for real
- Confirmation gates and per-node cooldowns
- Concurrency caps, so one fix never drains a whole pool
- Full audit trail of reasoning and actions; every software change can be rolled back
Works with your cloud provider
- Tells provider hardware faults from software issues
- Confirms hardware faults before escalating
- Evidence bundles and case tracking through RMA and repair
- Re-validates nodes before they rejoin the fleet
Kubernetes-native, so it fits the tooling you already run.
The memory tier, run for you
Long conversations and long documents fill GPU memory fast, and anything that doesn’t fit gets thrown away and recomputed. WEKA’s Augmented Memory Grid gives the KV cache somewhere to go. Forge deploys it, tunes it for your workload and runs it day to day.
That’s the “Nest too full” and “Hatched twice” problems on our home page, fixed at the source.
169,000 vs 46,000 tokens per GPU-hour
Tuned memory setup against GPU memory alone, on one 8-GPU node with the same software stack. Published by Nebius and WEKA, not a KTLO result. Your gap will be different, and the free scan measures it.
Read the Nebius and WEKA benchmarkThe rest of the hatchery crew
Forge fixes what’s broken. TokenMax decides where the power goes.
Ready to stop firefighting your fleet?
Connect Forge to your telemetry and see the first week of incidents it would have handled. Read-only to start.
Nothing changes in your cluster without your approval.
Expert hands. Guided by Forge.
Keep your physical GPU infrastructure ready for work. Forge CP pairs a trained technical team with Forge software to diagnose faults, maintain GPU systems, replace bad hardware and debug link issues.
Built for GPU data center operators and physical infrastructure teams. Forge brings together diagnostic evidence, root-cause analysis (RCA) and detailed maintenance playbooks so technicians know what to inspect, what to replace and how to verify the repair.
From fault evidence to verified repair
Forge guides the investigation. Trained technicians carry out the physical work and record the outcome.
- 1. DiagnoseFind the root causeCorrelate GPU errors, hardware logs and link telemetry in Forge to identify the affected component and guide the next checks.
- 2. PreparePlan the maintenanceCoordinate node isolation and the maintenance window with the operator. Follow the relevant hardware procedure and confirm the parts needed.
- 3. RepairDo the physical workReplace failed GPUs and other faulty components, inspect connections and troubleshoot cabling, transceivers and link issues using Forge-guided checks.
- 4. VerifyProve the fixRe-run GPU and fabric diagnostics, record the repair evidence and coordinate return to service after validation.
A technical team with the full fault history
Physical maintenance & hardware replacement
Technicians use Forge's diagnostic context and maintenance instructions to inspect GPU systems, replace failed parts and document what changed. Each repair stays connected to the original incident.
GPU & network link troubleshooting
Investigate NVLink, PCIe and network link faults using error logs and targeted checks. Trace issues to the relevant connection or component, perform the physical fix and check that link health recovers.
For cloud and neo cloud providers, Crucible adds burn-in and customer problem validation, while TokenMax optimizes power and cooling. For AI & ML teams running workloads, Forge automates cluster operations and provider escalation.
More useful output from the GPUs you already own.
AI factories often reserve power for the busiest moment, leaving valuable capacity unused. TokenMax helps turn that stranded capacity into more inference, more customers and more revenue—without expanding the site.
Same site power. More tokens delivered.
TokenMax connects the serving layer to the power and cooling reality underneath it, so every decision is guided by one business question: how do we produce more useful tokens at a lower cost?
NVIDIA’s 540 kW example: static provisioning strands 170 kW; dynamic allocation uses 475 kW and fits one more rack in the same budget.
More output from the same AI factory
TokenMax builds on NVIDIA’s DSX MaxLPS approach: make power, cooling and model serving work together instead of managing each one in isolation.
What TokenMax adds is the business layer: it connects the way models are served—through vLLM or NVIDIA Dynamo—to the power, cooling and network signals that determine cost and capacity. The result is a shared view of token throughput, latency, power and facility efficiency, from the serving layer down to the rack.
Source: NVIDIA, Maximizing AI factory performance per watt with NVIDIA DSX MaxLPS. We treat these as the ceiling, not the promise.
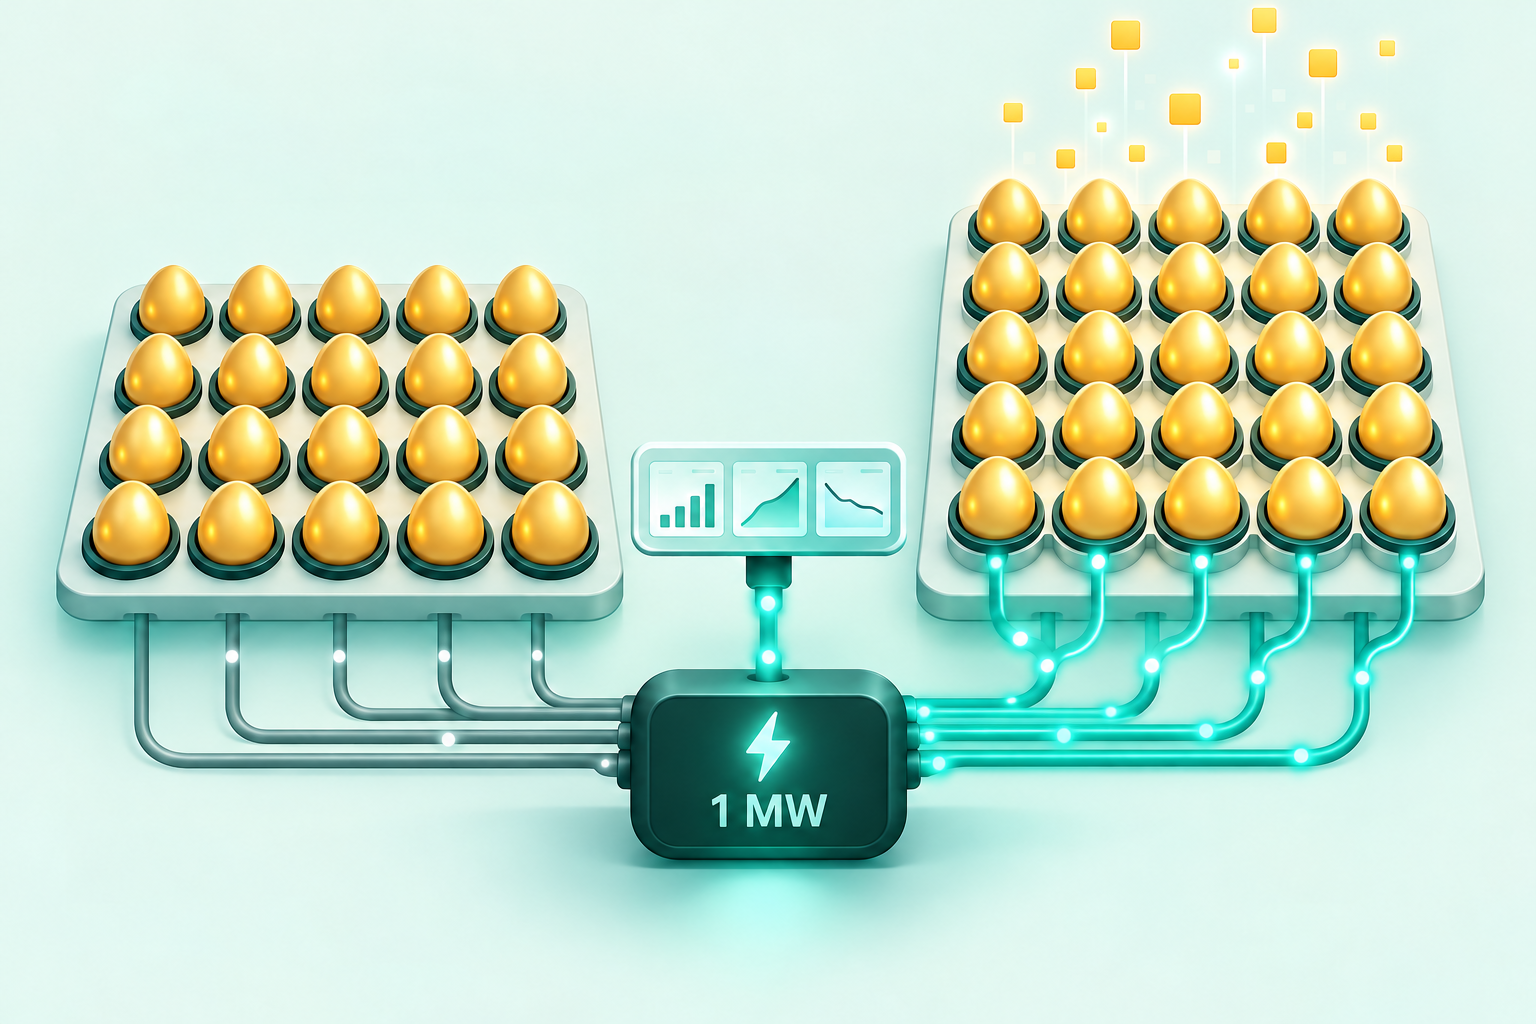
Same 1 MW. More golden eggs.
Bring 20–30% more sellable GPUs online within the same site power budget. That’s the TokenMax target: turn power reserved for peaks into capacity your customers can use.
Power stays reserved for each nest’s busiest moment.
Power follows the work, bringing more golden eggs online.
The intelligence starts with the workload.
TokenMax maps real application and LLM serving metrics to the GPUs, nodes and racks running them. It uses that context to dynamically reallocate available power as demand changes—keeping useful tokens flowing within your latency, thermal and site power limits.
Read the demand
Track token throughput, time to first token, request queues and prefill versus decode activity across your model-serving workloads.
Connect it to the hardware
Map those signals to GPU utilization, node and rack power, and cooling headroom. See where power is needed and where an allocation is sitting idle.
Power more golden eggs
Rebalance power budgets toward productive capacity as workloads change, within operator-approved limits. More GPUs available to sell, from the same megawatt.
Inspired by NVIDIA DSX MaxLPS: recover stranded power and increase capacity within a fixed site power envelope. TokenMax adds application and model-serving context to those power decisions. The illustration is a TokenMax concept, not an NVIDIA benchmark.
Three loops, three speeds
Observe, predict, decide, act, verify. The loops are nested so fast decisions never wait on slow ones.
Route the tokens
Scores every rack on predicted tokens/s per kW, power headroom, fabric congestion and thermal margin, then sends new requests, or moves decode sessions by KV-cache transfer, to the cheapest healthy rack.
Dynamo router weights, Kubernetes or Slurm placement, KV-cache migration
Steer the power
Forecasts demand for each workload class 15 to 60 minutes ahead, rebalances DPS group budgets, applies power profiles per node, and moves batch and prefill-heavy work to racks with reclaimed headroom.
DPS group budgets, APPM and WPPS profiles, GPU power limits over Redfish
Tune the cooling
Raises CDU and facility supply temperatures toward the 45°C design point when load and weather allow, stages chillers and free cooling, and pre-charges UPS or shifts deferrable work ahead of grid price peaks.
CDU and chiller set-points through the BMS, UPS charge schedule, demand response
Metrics that connect the business
From vLLM or NVIDIA Dynamo to the GPU, rack and facility, TokenMax keeps the important signals together: tokens per second, time to first token, customer latency, power per token, cooling efficiency and cost per million tokens.
| Layer | Example metrics | Source | Cadence |
|---|---|---|---|
| Workload | tokens/s, TTFT, inter-token latency, queue depth, batch size, KV-cache hit rate, prefill vs decode ratio, SLA class, $/1M tokens | Dynamo, vLLM or Triton metrics; Kubernetes or Slurm scheduler API | 1 s |
| GPU and node | power (W), SM clock, HBM bandwidth, utilisation, temperature, throttle reasons, NVLink traffic, power profile in force | DCGM, NVML, Redfish BMC | 1 s |
| Rack and power | rack kW vs budget, phase imbalance, busway load, breaker headroom, inlet and outlet temperature, DPS allocated vs observed power | DPS telemetry, rack PDU (SNMP or Redfish), busway meters | 1 to 5 s |
| Network and RDMA | switch port utilisation, ECN and PFC pause counts, RDMA retransmits, congestion, latency between racks, link errors | NVIDIA UFM or NetQ, switch telemetry (gNMI), RDMA counters | 1 s |
| DPU | host offload load, east-west flows per job, storage I/O, encryption load, DPU power and temperature | BlueField DOCA telemetry | 1 s |
| Cooling | CDU supply and return temperature and flow, delta-T, loop pressure, chiller load and COP, cooling-tower approach, free-cooling mode, outdoor wet-bulb | BMS (BACnet or Modbus), CDU controllers, weather feed | 10 to 60 s |
| Site and power shell | utility feed kW, UPS state of charge, generator readiness, grid price and carbon signal, demand-response events, site envelope remaining | DCIM, EPMS, utility API, site event bus | 10 to 60 s |
Safe by design
- Every control keeps its own guard: DPS power compliance, BMS interlocks, breakers.
- Set-points move only inside bands your operators approve.
- Recommend mode first. Each class of control acts on its own only after it beats the baseline for a set period.
- If telemetry goes stale or an SLA error budget is breached, a watchdog falls back to static MaxQ profiles and standard PID cooling.
- Every facility control needs a written operating band, agreed with your mechanical and electrical teams, before it acts on its own.
Integration points
- DPS gRPC API (nvidia.dcpower.v1) and dpsctl
- Redfish GPU power limits
- Kubernetes and Slurm APIs
- NVIDIA Dynamo router API
- BACnet and Modbus through the BMS
- SNMP and Redfish for PDUs
- Utility price and carbon APIs
Value from the first phase
You see your stranded power in phase one, before anything is automated. Each later phase has to prove its value in recommend mode before it acts on its own.
- Months 1 to 3ObserveOne telemetry fabric across every layer, and a live view of tokens/s per kW for each rack and chiller COP against IT load.
- Months 3 to 6ModelA digital twin replays your last 90 days and shows the cost per token and kWh the policy would have saved, in recommend mode.
- Months 6 to 9Act in seconds and minutesRouting, placement, power profiles and DPS budgets act on their own, inside operator bands. Cooling stays in recommend mode.
- Months 9 to 12Act in hoursCooling, chillers, UPS and demand response close the loop once the thermal model has held up through a full seasonal cycle. The watchdog fallback is tested every quarter.
Measured from day one
Three levers bring the cost per token down: more tokens per kW (reclaimed stranded power, right-sized power profiles), cheaper kW (warm-water cooling, chiller bypass, price- and carbon-aware time-shifting) and fewer operator hours (one control plane instead of separate power, cooling and scheduler consoles).
- Cost per million tokens, by workload
- Tokens/s per kW, per rack
- Stranded power, in kW
- PUE and chiller hours avoided
- Time to first token and p99 latency
- Decisions acted on vs overridden
- Operator hours per MW per month
NVIDIA projects up to 40% more GPUs in the same site power envelope.
We treat that as the ceiling, not the promise. Your targets come from replaying your own last 90 days of telemetry.
Become a design partnerThe rest of the hatchery crew
Forge fixes what’s broken. TokenMax decides where the power goes.
Same site power. More golden eggs.
We are taking on a small number of design partners: neo cloud providers and AI factories running NVIDIA racks who want their power to follow their tokens.
Phase one is read-only. Nothing moves until your operators approve the bands.
Every starship needs a Scotty.
The captain gets the credit. The engineer keeps the warp core running, finds the fault before it becomes a crisis, and somehow gets more out of the engines than the manual says is possible. KTLO is that engineer for AI clusters: human-in-the-loop AI infrastructure uptime managed services.
Why we started
KTLO was started by infrastructure and reliability engineers who kept losing GPU-hours to failures that never crashed loudly. Quiet throttling. Fabric links that degraded a little more each week. Pages at 3 a.m. that said something was wrong and nothing about what.
The tools for finding those problems were split across vendors and held together by CLI scripts and runbooks that lived in a few people’s heads.
What we’re for
To give every AI cluster operator one trustworthy way to detect degradation, understand it and fix it quickly, across compute, fabric and storage, on today’s hardware and the next generation.
Put simply: you bought the GPUs, and we make sure you get the compute. Every hour you pay for should turn into tokens your customers can use.
A managed service, not another dashboard
You don’t need one more screen to watch. Our software does the detection and triage, our engineers make the judgment calls automation can’t, and your team gets on with its own customers and products.
Vendor-neutral
One fault vocabulary and one alerting path across accelerator vendors and cloud providers, with no lock-in. Our first and deepest integration is with NVIDIA.
Safety before automation
Remediation starts with dry runs, confirmation gates, per-node cooldowns and concurrency caps. Automation is earned one step at a time.
Cloud native
Kubernetes-native software that fits into the tooling you already run, instead of asking you to rebuild around it.
The team
Engineers who have run, diagnosed and benchmarked GPU clusters in production AI clouds.
Ran AI cluster operations
Leads AI incubation teams, and previously ran AI cluster operations at a large AI cloud provider.
Diagnosed the failures
Previously diagnosed HPC, GPU and fabric failures at a hyperscale AI cloud provider, writing the detection logic and automating the remediations.
The company
KTLO AI Labs has been accepted into the NVIDIA Inception program. As a member, we are building on NVIDIA’s open source tools and open source AI models.
KTLO AI Labs partners with WEKA to support our customers’ growing infrastructure and scaling needs.
Put your GPUs back to work.
We’ll show you how much compute your fleet is leaving in the nest, and how to get it back.
Free and read-only. Nothing changes without your approval.